Inflation deflation.... The Universe from Planck
I've been away for a few days at the Synthetic Universes for Future Survey at the University of Western Australia (phew - Perth is a long way away!). It was an excellent meeting, presenting just what we need to do with regards to making synthetic universes so we can understand what is going on in our own.
As well as coinciding with the equinox, we also watched the press conference covering the latest results from the Planck Satellite. While this was a spectacular success, it also was a bit of a disappointment. You might wonder how this can be. Let me explain.
The Cosmic Microwave Background (CMB) was discovered in 1964, and it was realised that this was the ever-cooling radiation left over from the Big Bang. I have to show ab obligatory history of the universe to explain how it has trundled through the universe.
 You can think that the CMB was born at the end of inflation, and for a few hundreds of thousands of years the universe was a plasma soup, with protons, electrons and radiation all bouncing around. When the universe cooled enough, when it was around 380,000 years old, the electrons were able to join with the protons, and the first hydrogen atoms were born.
But once the hydrogen atoms form, then they don't play ball with the photons any more, and the "bouncing off each other" stops. The photons happily travel along, cooling as they go, until they are detected in our telescopes.
While the universe was very smooth just after inflation, in the 380,000 years until the first hydrogen forms, gravity had done its thing, and mass had started to move into the lumps that become the galaxies and clusters we see today. In human terms, it was still pretty smooth, but these very small density differences have an effect on the radiation. Some find themselves in the middle of baby clusters, and have to climb out, making them slightly cooler than the others. Others are in voids and gain energy as they fall towards the masses, making them slightly warmer.
This prediction that the CMB should have slightly different temperatures was made a long time ago, but it wasn't until the 1990s, with the observations of COBE that these temperature differences were observed. Here's what COBE saw


As well as coinciding with the equinox, we also watched the press conference covering the latest results from the Planck Satellite. While this was a spectacular success, it also was a bit of a disappointment. You might wonder how this can be. Let me explain.
The Cosmic Microwave Background (CMB) was discovered in 1964, and it was realised that this was the ever-cooling radiation left over from the Big Bang. I have to show ab obligatory history of the universe to explain how it has trundled through the universe.

But once the hydrogen atoms form, then they don't play ball with the photons any more, and the "bouncing off each other" stops. The photons happily travel along, cooling as they go, until they are detected in our telescopes.
While the universe was very smooth just after inflation, in the 380,000 years until the first hydrogen forms, gravity had done its thing, and mass had started to move into the lumps that become the galaxies and clusters we see today. In human terms, it was still pretty smooth, but these very small density differences have an effect on the radiation. Some find themselves in the middle of baby clusters, and have to climb out, making them slightly cooler than the others. Others are in voids and gain energy as they fall towards the masses, making them slightly warmer.
This prediction that the CMB should have slightly different temperatures was made a long time ago, but it wasn't until the 1990s, with the observations of COBE that these temperature differences were observed. Here's what COBE saw

This is the entire sky view of the CMB, with the red being slightly hotter, and the blue being slightly cooler. This was proclaimed one of the greatest discoveries of all time, but to scientists it's not just the fact that the blobs are there, but the properties of the blobs. Not exactly where they are, but how many big blobs there are compared to smaller blobs.
The distribution of blobs is normally expressed as a power spectrum (which those who are conversant with Fourier transforms may be familiar with).
Above is the power spectrum for the CMB, with large scales on the left and small scales on the right. The black points are the results from COBE, and these are pretty flat, saying that a range of typical blob sizes are expected. But COBE was limited by the resolution of its instruments and it could not see smaller scale blobs (they were blurred out).
After COBE, a range of other telescopes, some carried aloft by balloon, with sharper eyes, were able to see smaller and smaller blobs; these are the other coloured points in the plot. As you can see, there is a peak around 200, meaning that there are more blobs of that particular size than those around 10 or 1000.
However, if you look closely near 1000, there appears to be another peak. In fact, our theories of the early universe and inflation predict these peaks, and predict that there should be more beyond 1000. We needed even sharper eyes!
And that's that we got with WMAP, which was launched in 2001. Here's the view of the CMB sky as seen by WMAP;

If you look at the COBE map, you can see that there is a good correspondance, with big cool and hot spots seen in both, but there is soooooo much more resolution with WMAP. What about the power spectrum now?

The big peak is still there, as is the second people, and now another is clearly visible. It might seem like a lot of work, but the red curve is the fit to the data using our cosmological models, and it is incredible how well it work. This fit gives us the measure of the make-up of the universe; if you want to see how it works, check out Wayne Hu's superb animations.
And now to Planck, which was launched in 2009. How does the sky look to it?
A quick glimpse reveals more detail than WMAP, but here's a more direct comparison.

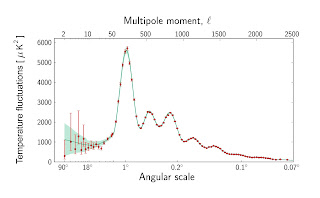
Clearly, the picture with Planck is so much clearer! And this is reflected in the power spectrum.

Again, the curve through the data is the best fit cosmological model, and it work. And it works well! Incredibly so. And here's where the problems begin....
Problems you ask? What problems? Surely this is beautiful?
Yes, it is. But what more have we learnt about the universe? Well, its make up and age etc have been tweaked a little. Here's the current energy budget
Small changes. Our prevailing model of the universe, a universe dominated by a dark energy which is consistent with a cosmological constant, works extremely well in explaining the cosmos we see around us.
While this is an incredible discovery, and you might think that this should fill us with elation, we are left with a problem of asking "what do we do next?" While there are lots of theoretical ideas bubbling around out there, some robust, lots less than speculative, what we are seeing is a particularly simple universe.
What would have been cool would have been if there were deviations from the expected signal, providing clues to where we should be looking next, pointing to what ideas need exploring, to what might provide the next big break through.
But the universe as laid down in the 1920s, and honed in the last few decades, works extremely well. We have our "Standard Model" of cosmology, similar to the particle physicists are scrabbling for ideas to get beyond their "Standard Model".
However, both have small "anomalies", not really overly significant (which means they could go away) but might be a starting point. We'll have to wait and see...
At the Perth meeting, we had a little sweep stake on what we thought the outcome of the Planck results may be. I was the tic-tac man and here were the votes on what the room (of around 40-50) thought the results would be (taken from AstroKatie).

Virtually nobody thought that cosmology was about to be over turned, and the vast majority wanted "a hint of something" that would point us in a new direction. While there was a hint, it had been seen in the WMAP result, "Vanilla Lambda-CDM" won. Well, it was the one I voted for, and I was the adjudicator :)


When I saw the ESA statement I hoped that this would be your topic this week - and your summing up neatly fills some gaps in all the media articles.
ReplyDeleteI lost you a little bit with the sudden jump to energy distribution pie charts. In what way do the revised energy ripples contribute to a decrease in dark energy and an increase in dark matter and baryonic matter?
Hi Greybeard - you should look at the Wayne Hu website I mentioned, but basically the positions of the peaks and their relative heights depend upon the mix of material in the universe - change the amount of matter relative to dark energy, and you get peaks in different places. So, fitting the peaks tells you the make-up of the universe. Easy!
ReplyDeleteDoes anyone know why Planck uses a different colour scheme than WMAP?
ReplyDeleteI don't know. Although I think that there is no internationally recognised standard for the CMB colour-map scheme, but I think WMAP5 was better :)
DeleteHi! What do you think of that paper that says the inflation field as constrained by the Planck results leads to unlikely models being required? That it is unlikely that the higgs field will be strong enough to make up for what the inflator field lacks, eliminating inflation and hence the BB?
ReplyDeleteI gather the author is somewhat of a rablerouser...