The origin of the split red clump in the Galactic bulge of the Milky Way
I have been swamped recently, not only at work (I am teaching electromagnetism to first year students) but also at home where we are renovating (and I am not too geeky enough to wield a sledge hammer). So, apologies for the sparse posting. The renovating is slowly approaching its conclusions (although we have lived almost a month with no doors inside the house), and research is trundling, so I will try and get back on top of posting.
I should have posted this a little while ago, but the first paper in a new survey of the Galactic Centre was accepted for publication. The ARGOS project, as it is known, was originally intended to be a large scale international survey of a large chunk of sky, but we were not awarded time for that, and now it is a program focused upon the Galactic Bulge.
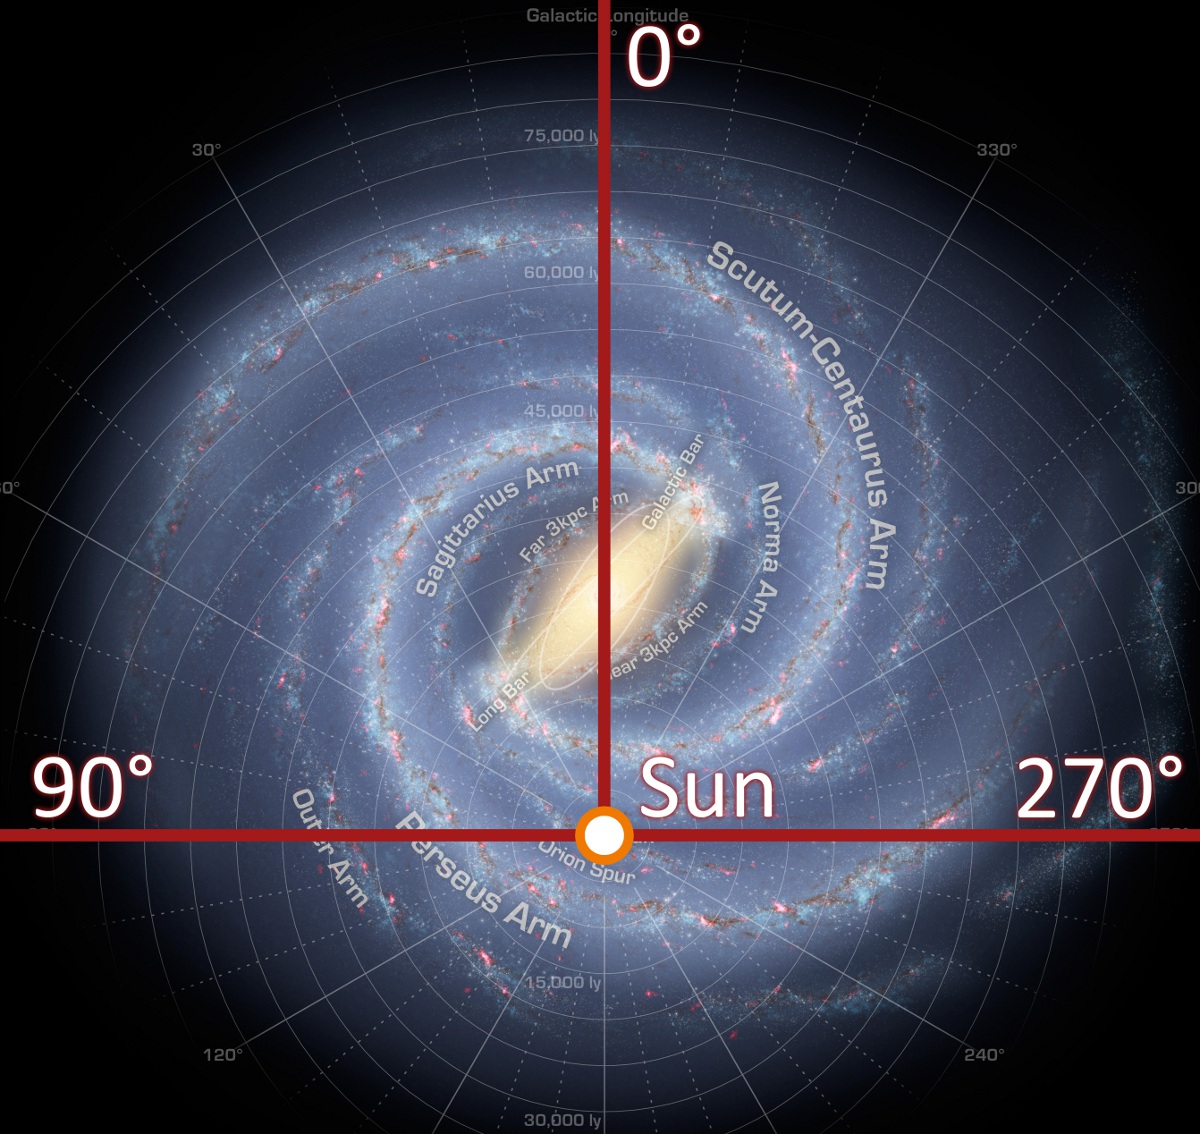
It might seem strange, but while we can plainly see the centre of the Galaxy from here in Australia, there is a lot we don't know about it. It was only in the last 10-20 years we have come to understand that the Milky Way's bulge possesses a prominent bar that had not been seen before. In fact, it is more complicated than that, as there appears to be more than one bar structure. Here's an artists interpretation of the Milky Way (pinched from Wikipedia, formally of NASA).
 So, how do we understand what's going on? We need to basically measure the speed and chemistry of lots and lots of stars, and to do this we need to do spectroscopy. Generally, this is very time consuming as, with even a large-ish telescope (like the 3.9m Anglo-Australian Telescope), as you need to spend about an hour per star to get enough signal to make meaningful measurements.
I've written before about the solution to this, essentially you use lots of optical fibres at once to collect the light from a lot of stars. For ARGOS, we used the 2dF/AAOmega spectrograph to look at around 400 stars at once. In fact, we got spectral for more than 27000 stars. Cool eh?
The first paper from this data has a title which may seem mysterious to the lay person. It is "The origin of the split red clump in the Galactic bulge of the Milky Way". OK, some of the words make sense, but what is a red clump, and why it is split?
The Red Clump is a "clump" (i.e high density) of stars on a colour-magnitude diagram (more traditionally called a Hertzsprung-Russell diagram. You do what it says on the tin, namely plot a point for each star on a plane, where one axis is colour, and the other is brightness (or magnitude).
The clump is the blob of stars at about (1,0) in this plot

(taken from the webpage of the late, great polish astronomer, Bohdan Paczynski). I won't go too much into stellar evolution here, but where you see clumps on the colour-magnitude diagram, this indicates relatively stable phases of the life of a star (so stars hang about there for a bit longer).
The cool thing about the clump is that is seems (modulo a few physical things) that the stars in there have roughly the same intrinsic brightness and so you can use them to do the most difficult thing in astronomy, namely measuring distances.
So, what does a "split red clump" mean? Well, it means that what we are seeing in the bulge is not a nice, simple "blob" of stars at some distance, but there is more complex 3-D structure, and chunks along the line of sight give us different features in the structure of the red clump at different locations.
What ARGOS shows us it that this structure means that the bulge has "boxy/peanut" orbits (I will write about these in the future) and that these orbits grew due to a complex interplay between the disk of stars and a bar instability. Make sense? Essentially, what it boils down to is the growth of galaxies, even on small scale, like the formation of an individual bulge, is complicated. None of the nice, simple pictures presented in textbooks are actually realised. It's all a mess. Fantastic! (don't take mess to mean that we don't understand what is going on!)
This is a great piece of work, lead by ANU PhD student, Melissa Ness. Well done Melissa!
And here's a bonus question. Some of the words in this post were originally in the 1980s movie, and song of the same name, Flash. Can someone find them?
I should have posted this a little while ago, but the first paper in a new survey of the Galactic Centre was accepted for publication. The ARGOS project, as it is known, was originally intended to be a large scale international survey of a large chunk of sky, but we were not awarded time for that, and now it is a program focused upon the Galactic Bulge.
It might seem strange, but while we can plainly see the centre of the Galaxy from here in Australia, there is a lot we don't know about it. It was only in the last 10-20 years we have come to understand that the Milky Way's bulge possesses a prominent bar that had not been seen before. In fact, it is more complicated than that, as there appears to be more than one bar structure. Here's an artists interpretation of the Milky Way (pinched from Wikipedia, formally of NASA).
I've written before about the solution to this, essentially you use lots of optical fibres at once to collect the light from a lot of stars. For ARGOS, we used the 2dF/AAOmega spectrograph to look at around 400 stars at once. In fact, we got spectral for more than 27000 stars. Cool eh?
The first paper from this data has a title which may seem mysterious to the lay person. It is "The origin of the split red clump in the Galactic bulge of the Milky Way". OK, some of the words make sense, but what is a red clump, and why it is split?
The Red Clump is a "clump" (i.e high density) of stars on a colour-magnitude diagram (more traditionally called a Hertzsprung-Russell diagram. You do what it says on the tin, namely plot a point for each star on a plane, where one axis is colour, and the other is brightness (or magnitude).
The clump is the blob of stars at about (1,0) in this plot
(taken from the webpage of the late, great polish astronomer, Bohdan Paczynski). I won't go too much into stellar evolution here, but where you see clumps on the colour-magnitude diagram, this indicates relatively stable phases of the life of a star (so stars hang about there for a bit longer).
The cool thing about the clump is that is seems (modulo a few physical things) that the stars in there have roughly the same intrinsic brightness and so you can use them to do the most difficult thing in astronomy, namely measuring distances.
So, what does a "split red clump" mean? Well, it means that what we are seeing in the bulge is not a nice, simple "blob" of stars at some distance, but there is more complex 3-D structure, and chunks along the line of sight give us different features in the structure of the red clump at different locations.
What ARGOS shows us it that this structure means that the bulge has "boxy/peanut" orbits (I will write about these in the future) and that these orbits grew due to a complex interplay between the disk of stars and a bar instability. Make sense? Essentially, what it boils down to is the growth of galaxies, even on small scale, like the formation of an individual bulge, is complicated. None of the nice, simple pictures presented in textbooks are actually realised. It's all a mess. Fantastic! (don't take mess to mean that we don't understand what is going on!)
This is a great piece of work, lead by ANU PhD student, Melissa Ness. Well done Melissa!
The origin of the split red clump in the Galactic bulge of the Milky Way
(Submitted on 4 Jul 2012)
Near the minor axis of the Galactic bulge, at latitudes b < -5 degrees, the red giant clump stars are split into two components along the line of sight. We investigate this split using the three fields from the ARGOS survey that lie on the minor axis at (l,b) = (0,-5), (0,-7.5), (0,-10) degrees. The separation is evident for stars with [Fe/H] > -0.5 in the two higher-latitude fields, but not in the field at b = -5 degrees. Stars with [Fe/H] < -0.5 do not show the split. We compare the spatial distribution and kinematics of the clump stars with predictions from an evolutionary N-body model of a bulge that grew from a disk via bar-related instabilities. The density distribution of the peanut-shaped model is depressed near its minor axis. This produces a bimodal distribution of stars along the line of sight through the bulge near its minor axis, very much as seen in our observations. The observed and modelled kinematics of the two groups of stars are also similar. We conclude that the split red clump of the bulge is probably a generic feature of boxy/peanut bulges that grew from disks, and that the disk from which the bulge grew had relatively few stars with [Fe/H] < -0.5
And here's a bonus question. Some of the words in this post were originally in the 1980s movie, and song of the same name, Flash. Can someone find them?


Some other things from the 80s red giants, galactic red giants, peanut/boxy bulges and KCF only thing missing is radial velocities
ReplyDeleteSimply explained, Thanks Geraint
ReplyDelete